Solar Panel Statistics for 2025
Remember when solar panels were a niche technology seen only on a few rooftops? Well, those days are fading fast! By 2050, 90% of total electricity generation will come from renewable energy. Within this target, 70% is expected from solar PV and wind power.
Let's delve into the world of solar panel statistics, exploring how much solar power is being used, its impact, and exciting trends shaping the future of this renewable energy source.
This article will shed some light (pun intended) on the potential of solar panels and the trends shaping the future of renewable energy.
- Solar panel installation and capacity growth
- Solar energy jobs
- Cost of solar panels
- Efficiency of solar panels
- Solar power production by country
- Solar panel government support and incentives in the UK
- Environmental impact of solar power
- Payback period and long-term savings
- Solar panel market outlook as of 2025
- Market trends and future projections
Solar panel installation and capacity growth
Fueled by sunshine and innovation, the solar PV industry is growing! Advancements in technology are making panels more efficient and affordable, while government incentives and a growing focus on environmental responsibility are creating a perfect storm for solar power. Recent data predicts the solar PV market will soar at a blistering compound annual growth rate (CAGR) exceeding 20% from 2021 to 2026.
As of May 2023, the United Kingdom boasts a significant solar capacity of 15.1 GW across 1,334,453 installations. This marks an increase of 6.4% (911 MW) since May 2022.
The country is on a trajectory to expand its solar capacity, aiming to reach 40GW by 2030. This ambitious goal underscores the UK's commitment to renewable energy and its role in mitigating climate change.
Here's a glimpse into the impressive statistics surrounding the solar industry based on data from IEA and Statista:
- The global solar capacity is expected to hit a massive 1.3 terawatts (TW) by 2023, a huge leap from just 5 gigawatts in 2005. That's a 188-fold increase in less than two decades!
- Solar energy is not just powerful; it's friendly to the planet. Did you know 90% to 97% of solar panel materials can be recycled and reused? Additionally, solar energy users save an estimated 35 tons of CO2 emissions and 75 million barrels of oil yearly.
- China currently reigns supreme in solar power generation, boasting over 306 gigawatts of capacity. However, the US, Japan, Germany, and India are close behind, exceeding 40 gigawatts.
- Solar panels are the go-to method for capturing the sun's energy. In the US alone, solar power generation reached 145.6 terawatt hours in 2022. The trend continues in the UK, where over 17,000 households embraced solar power each month in 2023.
- The future of solar is bright! The smart solar power market is expected to reach approximately £36.25 billion by 2031, while the global solar roofing industry anticipates a market size of £183.62 billion by 2031.
- Solar is the undisputed champion of fast-growing electricity sources. For the 18th year in a row, it has experienced exceptional growth, rising by 24% year-on-year in 2020. This impressive surge alone could power the entire nation of South Africa for a year.
There has been significant growth in the solar photovoltaic (PV) industry in recent years. This can be attributed to several factors, including technological advancements, government incentives, and a growing awareness of the environmental benefits of solar energy. Market research suggests that the global solar PV market is poised for significant expansion, with a projected compound annual growth rate exceeding 20% between 2021 and 2026.
One of the primary drivers of this growth has been the declining cost of solar panels. However, a noteworthy exception to this trend has been observed in the United Kingdom. The UK market experienced a price increase for solar panels following the COVID-19 pandemic in 2021. The average cost per solar panel system ranges from £2,500 - £3,500 to £12,000 - £13,000 as of 2025.
Solar energy jobs
The solar panel industry is experiencing job growth, with a significant increase in residential solar jobs and a decline in utility-scale solar jobs. Manufacturing jobs are also expected to rise in the future. Women's participation in the industry is higher than in other renewable energy sectors, and the industry employs professionals with a diverse range of skills.
There are several trends in the solar panel industry regarding job distribution and job titles:
- Job growth: The solar industry experienced a 3.5% increase in overall jobs in 2022, with a total of 263,883 workers spending the majority of their time on solar-related work.
- Utility-scale solar jobs: Utility-scale solar jobs declined by 18% in 2022, while residential solar experienced its best year ever with a 40% growth in installations.
- Residential solar jobs: Residential solar jobs increased by 11%, or about 9,500 jobs, due to the rising popularity and availability of state and federal incentives.
- Manufacturing jobs: Solar photovoltaic panel manufacturing jobs totalled 33,473 in 2022, but these jobs could rise significantly in 2023 and beyond if companies follow through on announcements for new domestic manufacturing plants.
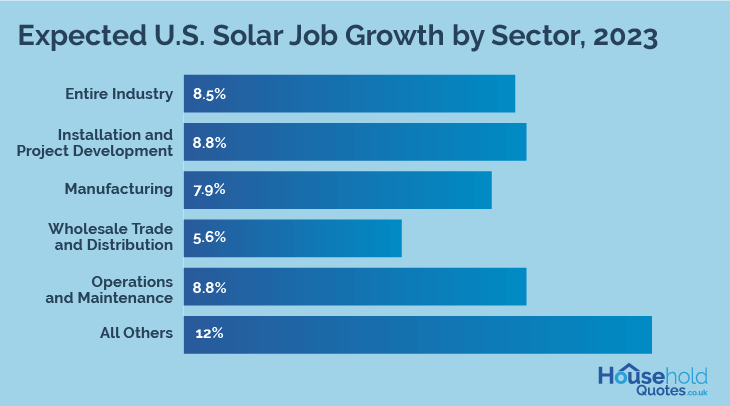
- Job categories: The solar industry employs professionals with a diverse array of skills, including installation, operations, maintenance, manufacturing, and project development.
- Union representation: 10.5% of workers in the solar industry are represented by a union or covered by a project labour agreement that provides union-scale pay, which is an increase from 10.1% in 2021.
- Women's participation: Women accounted for 40% of the total workforce in the solar PV industry in 2021, which is significantly higher than the average share of women employed in all renewable sectors.
Here's the gender distribution in different segments of the solar PV industry:
| Solar PV industry segment | Women | Men |
|---|---|---|
| Solar PV Manufacturing | 47% | 53% |
| Service providers | 39% | 61% |
| Developers | 37% | 63% |
| Solar PV installers | 12% | 88% |
| Overall Solar PV industry | 40% | 60% |
The renewable energy sector employed 12.7 million people worldwide in 2021, with a jump of 700,000 new jobs in just 12 months.
Solar energy was found to be the fastest-growing sector, providing 4.3 million jobs in 2021, more than a third of the current global workforce in renewable energy.
The solar industry is expected to continue growing and is projected to be the source of 14 million jobs by 2030.
Cost of solar panels
The cost of solar panels in the UK typically ranges from £2,500 - £3,500 to £12,000 - £13,000 including supply and installation, depending on the system size.
For example, a 4kW system suitable for a 2-3 bedroom house may cost between £5,000 - £6,000, while a larger 6kW system for a 4-5 bedroom house could be priced between £9,500 - £10,500.
The average cost of a 350W solar panel lies between £150 and £500. Here's an overview of the solar panel prices for various households:
| House size | Solar system size | Price |
|---|---|---|
| 1-2 bedrooms | 2kW | £2,500 - £3,500 |
| 1-2 bedrooms | 3kW | £4,500 - £5,500 |
| 2-3 bedrooms | 4kW | £5,000 - £6,000 |
| 2-3 bedrooms | 5kW | £7,500 - £8,500 |
| 4-5 bedrooms | 6kW | £9,500 - £10,500 |
| 6+ bedrooms | 10kW | £10,000 - £11,000 |
| 6+ bedrooms | 12kW | £12,000 - £13,000 |
Despite the global trend of decreasing solar panel costs, UK prices have not followed a clear downward trajectory, with costs in 2024 being higher on average compared to 2013.
Efficiency of solar panels
Solar panel efficiency represents how well a solar panel converts sunlight into energy. The higher the efficiency rate, the more energy is converted into electricity for your home. Solar panels with an 18% efficiency rating will convert 18% of the sun's energy into electricity.
The most efficient commercially available solar panels are around 22.8% efficient.
Here's an overview of leading solar panel brands and the efficiency of the solar panels available for home installations:
| Brand | Model | Efficiency |
|---|---|---|
| SunPower | M-Series 440 W | 22.8% |
| REC | Alpha pure-R 430 W | 22.3% |
| Panasonic | EverVolt HK Black Series 410 W | 22.2% |
| Maxeon | Maxeon 3 BLK-R 420 W | 22.2% |
| Jinko Solar | Tiger Neo N-type 54HL4R-B 440 W | 22.02% |
| Silfab | SIL - 420 BG 420 W | 22% |
As of 2024, the record for the most efficient solar cell belongs to Fraunhofer ISE. Their impressive III-V four-junction CPV cell achieved a remarkable 47.6% efficiency in May 2022. This ongoing research paves the way for even more efficient solar energy conversion in the future.
Solar power production by country
The use of solar energy is rapidly increasing around the globe. By April 2022, total global solar capacity had reached an impressive 1 terawatt (TW). China is the undisputed leader in this field, boasting a staggering 390 gigawatts (GW) of solar capacity, nearly half of the global total.
There are two main solar power technologies: photovoltaic (PV) systems and concentrated solar power (CSP).
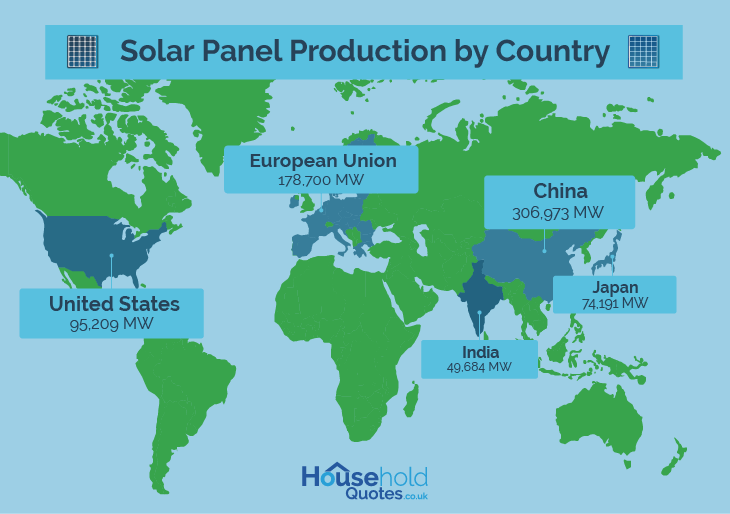
Looking at individual countries, China remains the champion in 2024 with 306,973 MW of solar power production, followed by the United States (95,209 MW), Japan (74,191 MW), Germany (58,461 MW), and India (49,684 MW). Interestingly, if the European Union (EU) were considered a single entity, it would hold the second-highest solar capacity globally at a combined 178,700 MW.
Various factors drive this surge in solar power adoption. China continues to dominate production, reaching a remarkable 430 GW of solar capacity by April 2023. The United States has set an ambitious target of installing 215 GW by 2030, while Japan aims for a carbon-neutral society powered partly by solar energy by 2050.
Germany, a longstanding leader in renewable energy, aspires to generate 65% of its electricity from renewable sources. India, too, has set a goal of achieving 100 GW of solar power capacity by 2022.
The United Kingdom's solar power market is on a surge, with an impressive projected compound annual growth rate (CAGR) of 23.53% over the next five years. As of May 2023, the UK has reached a notable 15.1 GW of solar capacity spread across 1,334,453 installations.
This marks a significant rise of 6.4% (911 MW) since May 2022. The country has set ambitious solar power targets to solidify its commitment to solar energy further, aiming to reach a remarkable 40 GW of installed capacity by 2030.
Solar panel government support and incentives in the UK
The UK government has implemented several schemes to encourage the adoption of solar panels.
Energy Company Obligation 4 (ECO4)

ECO4 is a government-funded scheme that aims to improve the energy efficiency of homes in England, Scotland, and Wales. It offers partial or fully free solar panel installations for eligible households.
The scheme runs from April 1, 2022, to March 2026.
Smart Export Guarantee (SEG)

The Smart Export Guarantee (SEG) is a scheme that allows homeowners with solar panels to sell excess energy back to the grid. It was introduced on January 1, 2020, and is open-ended.
Under this scheme, homeowners can receive payments of up to 7.5p per kilowatt-hour (kWh) for the electricity they generate and export to the grid.
0% VAT until 2027

From April 1, 2022, to March 2027, the UK government has implemented a VAT-free period for solar panel installations. This means that homeowners can save on the installation costs of solar panels during this period.
The relief covers installations of energy-saving materials in residential accommodation and charitable buildings, with a reversion to the reduced rate of 5% VAT from 1 April 2027. The list of energy-saving materials includes solar panels, water source heat pumps, electrical battery storage, and smart diverters.
From 1 February 2024, the scope of the relief is being extended to include installations in buildings used solely for relevant charitable purposes.
Commercial installations, secondhand panels, and separate purchases and installations are not covered by this relief and are taxed at the standard rate
Environmental impact of solar power
The European Green Plan emphasises the urgency of decarbonising the EU's energy system to achieve ambitious climate goals by 2030 and 2050. The REPowerEU plan specifically highlights the critical role of photovoltaic systems (solar panels) in this transition.
While the PV technology significantly reduces pollutant and greenhouse gas emissions, it's not without its environmental downsides. These include impacts on biodiversity and habitat loss, potential climatic changes, resource consumption, and the disposal of PV modules at the end of their lifespan.
The following key environmental considerations to explore are:
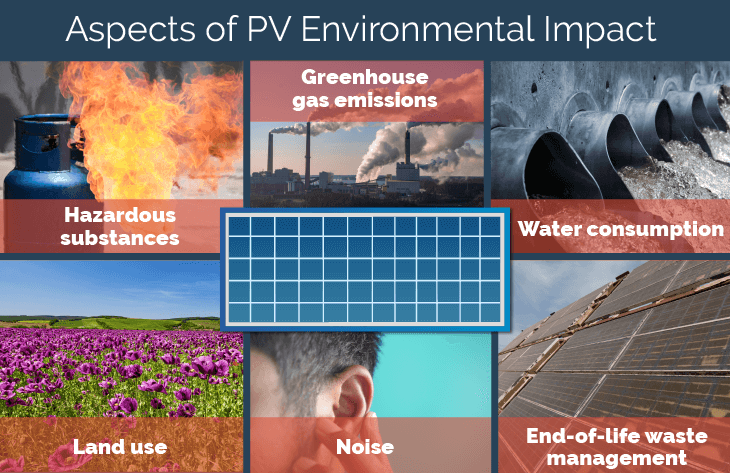
Land use
Under the "Net Zero Emissions by 2050" scenario, global installed photovoltaic (PV) capacity is projected to reach a staggering 4,400 gigawatts (GW) by 2030 and 14 terawatts (TW) by 2050. Rooftop PV capacity is expected to contribute roughly 1,800 GW, with land-based installations making up the remaining 2,600 GW.
For Europe specifically, the rooftop and land-based PV capacity is to reach around 300 GW by 2030. The ambitious Solar Energy Strategy outlines Europe's goal of nearly 600 GW by 2030. Notably, the strategy emphasises installing at least 40% of this capacity on rooftops by that same year.
However, ground-mounted PV plants can lead to greater land use conflicts, such as agriculture, forestry, conservation, and even urban development.
For example, widespread solar farms might affect food security, biodiversity protection, or local employment opportunities.
Greenhouse gas emissions
According to research, thin film solar panels boast the lowest carbon footprint among the three types, emitting only 35.5 g CO2-equivalent per kWh. This is compared to 61.8 g CO2-eq./kWh for monocrystalline and 52.2 g CO2-eq./kWh for polycrystalline.
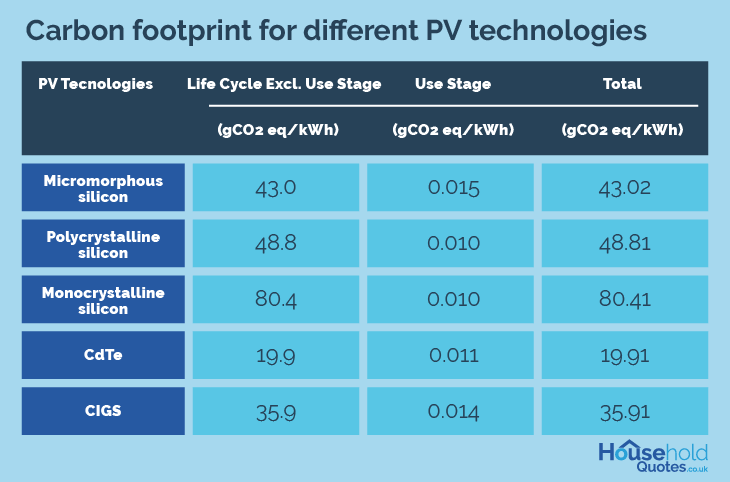
Multiple studies demonstrate that 80–95% of CO2 emissions come from the manufacturing stage. Solar panel end-of-life disposal phase makes between 5 and 20% of carbon emissions.
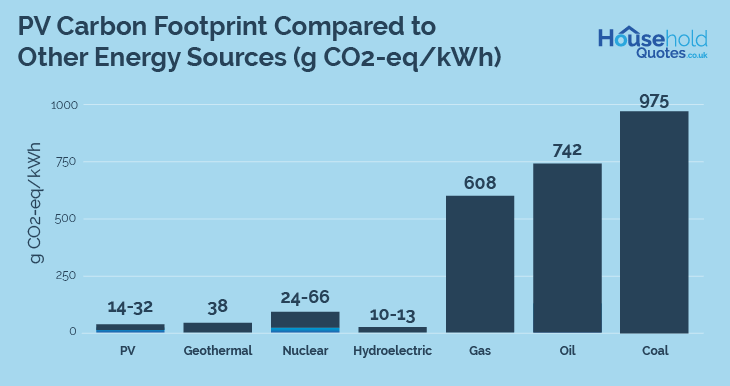
Photovoltaic (PV) solar systems boast a carbon footprint estimated in the range of 14–130 grams of carbon dioxide equivalent per kilowatt-hour (g CO2-eq/kWh). This is significantly lower compared to traditional fossil fuel power plants, with gas at 608 g CO2-eq/kWh, oil at 742 g CO2-eq/kWh, and coal at a hefty 975 g CO2-eq/kWh.
However, it's important to note that PV solar has a higher carbon footprint than some other renewable energy sources.
Concentrated solar power (CSP) falls within a range of 14–32 g CO2-eq/kWh, while wind power sits between 8–23 g CO2-eq/kWh. Geothermal (38 g CO2-eq/kWh), nuclear (24–66 g CO2-eq/kWh), and hydroelectric (10–13 g CO2-eq/kWh) power plants all generally have lower carbon footprints.
Hazardous substances
Extracting and converting quartz into polycrystalline silicon (poly c-Si) requires high-temperature equipment, making it an energy-intensive process.
However, this material is neither toxic nor poses a danger to production workers or public safety during its use in solar cells.
When it comes to environmental hazards, concerns often focus on cadmium and lead, both classified as toxic heavy metals. However, in PV cell manufacturing, cadmium is used in compounds with greater chemical stability, making them safer than pure cadmium.
Cadmium telluride is non-volatile, meaning it cannot be inhaled, and it's also insoluble in water. Therefore, its use in solar cells is considered safe for humans and the environment.
But burning coal and gasoline releases significantly more of these types of substances—around 300 times the amount compared to CdTe used in solar panels.
Polycrystalline silicon production contributes the most to potential human health impacts (over 30%), followed by wafer cutting (around 25%) and photovoltaic module production (approximately 20%).
Water use
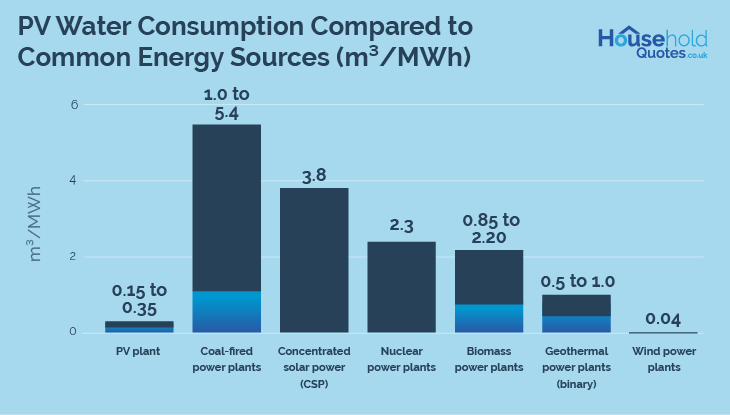
Studies show that despite the water used in manufacturing, the lifetime water consumption of PV power plants is generally lower than most other energy sources.
On average, PV plants use between 0.15 and 0.35 cubic metres of water per megawatt-hour (m³/MWh) of electricity generated.
Here's a comparison with other common energy sources:
- Coal-fired power plants: 1.0 to 5.4 m³/MWh
- Concentrated solar power (CSP): 3.8 m³/MWh
- Nuclear power plants: 2.3 m³/MWh
- Biomass power plants: 0.85 to 2.20 m³/MWh
- Geothermal power plants (binary): 0.5 to 1.0 m³/MWh
- Wind power plants: 0.04 m³/MWh (lowest consumption)
As you can see, solar power offers a significant advantage in terms of water usage compared to most traditional and some alternative energy sources. However, considering the entire life cycle is important for understanding a solar power plant's water footprint.
Noise pollution
Noise pollution is a factor to consider when installing a photovoltaic (PV) solar power plant. Just like any other industrial facility, a solar plant must be designed and operated in compliance with national and local noise regulations.
Noise can be generated during three stages of a PV system's lifespan: construction, operation, and maintenance. The main culprits for noise are inverters, transformers, cooling fans, and trackers used for adjusting panel angles.
The level and pitch (frequency) of noise will vary depending on different models of inverters, transformers, and fans will have varying noise characteristics. Also, larger plants naturally have a greater noise footprint compared to smaller installations.
Placing a solar plant near residential areas requires stricter noise control measures compared to remote locations.
A study by Tawalbeh provides some reference points:
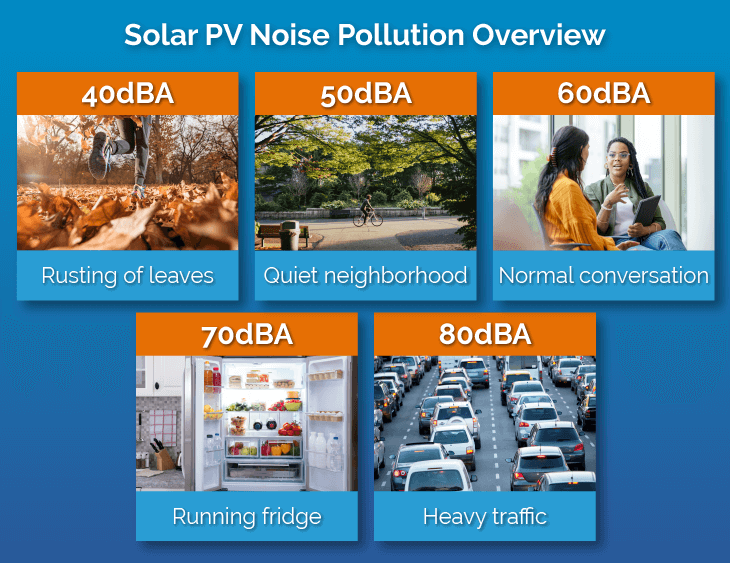
- Inverters: Average sound pressure level (SPL) ranges from 40 to 70 decibels (dBA) measured at a 1-metre distance, depending on the inverter's power output and cooling method. 40dBA compares to a quiet library or the rustling of leaves. 70dBA is comparable to a dishwasher or a busy city street.
- Transformers: Average SPL falls between 50 and 80 dBA at 1 metre distance, depending on the size and type of transformer used. 50dBA can be comparable to a quiet suburban neighbourhood during the day. 80dBA sounds like heavy traffic, a loud vacuum cleaner, or a garbage disposal unit.
- Cooling fans: Average SPL is between 40 and 60 dBA at 1 metre distance, varying based on the fan's speed and type. 40dBA compares to a quiet library or the rustling of leaves. 60dBA translates to a normal conversation or a running fridge.
End-of-life waste management
Solar photovoltaic (PV) systems, much like other long-lasting products, boast lifespans stretching into decades – especially with proper care. While some PV modules can even be reused or refurbished for continued electricity generation after roughly 30 years, all systems eventually reach their end-of-life (EOL).
The significant growth of solar energy presents a future challenge: managing PV waste. A projection indicates a dramatic increase in PV waste as a percentage of new installations, rising from just 0.1% in 2016 to a staggering 80% by 2050.
This underscores the critical need for developing effective solutions for dealing with solar panels at the end of their operational lifespan.
Payback period and long-term savings
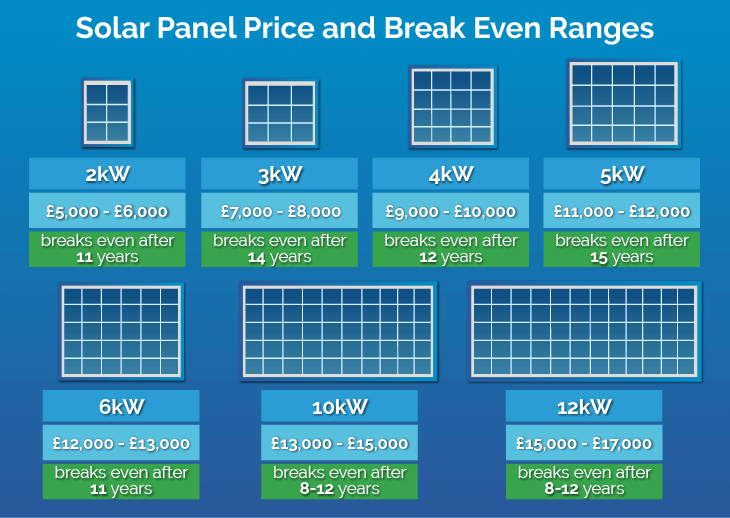
The typical break-even time for solar panels in the UK is estimated to be between 7 and 10 years. However, solar panels have an average lifespan of 25 years, which means that after the initial payback period, homeowners can enjoy significant savings on their energy bills.
Here is a quick overview of solar panel system savings
| System size | Annual savings | Savings after 25 years | Break-even point |
|---|---|---|---|
| 2kW | £440 | £11,000 | 7 |
| 3kw | £440 | £11,000 | 9 |
| 4kW | £660 | £16,500 | 8 |
| 5kW | £660 | £16,500 | 10 |
| 6kW | £1,005 | £27,500 | 10 |
| 10kW | £1,005+ | £27,500+ | 8–12 |
| 12kW | £1,005+ | £27,500+ | 8–12 |
The addition of a solar battery can further increase energy savings by up to 90%.
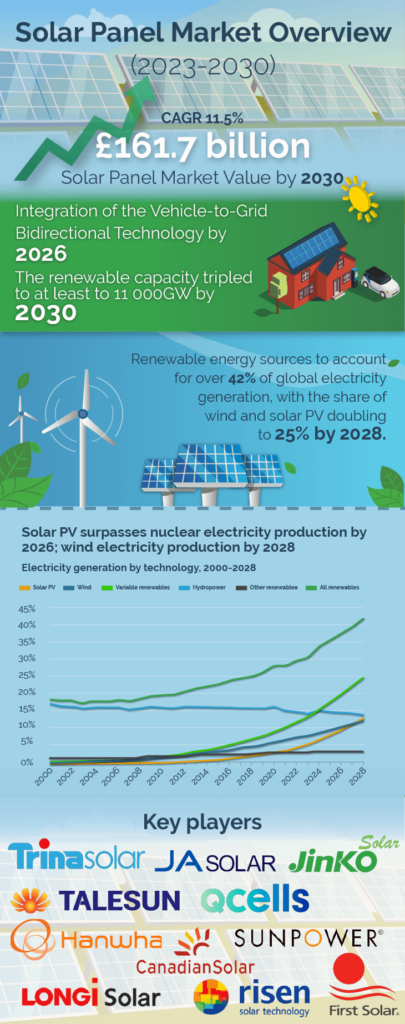
Solar panel market outlook as of 2025
The solar panel market outlook as of 2024 is promising, with continued growth and advancements in technology. The solar energy market is expected to grow from £131.4 billion in 2024 to £326.5 billion in 2028, with a compound annual growth rate (CAGR) of 25.3%. The solar photovoltaic panel manufacturing market is also expected to grow from £186.6 billion in 2024 to £283.6 billion in 2028, with a CAGR of 11.6%.
The global solar market is expected to see a slowdown in installation growth in 2024 compared to the rapid growth rates seen in recent years. This is due to the industry passing the inflexion point on the S-curve and maturing.
However, the global solar market is still expected to grow significantly, with projections for 270 GW of new solar installations worldwide in 2023.
Significant trends in the forecast period include advancements in solar panel technologies, solar tracking systems, digitalisation and smart grid integration, floating solar installations, and hybrid energy systems. The solar industry is also expected to focus on expanding production capacity, using artificial intelligence in manufacturing, transnational solar power networks, and ultra-efficient solar panels.
Market trends and future projections
The UK solar power market is projected to grow at a compound annual growth rate (CAGR) of 23.53% over the next five years. This growth is driven by increasing demand, technological advancements, and economies of scale that are expected to lower costs and improve efficiency.
The solar panel industry in the UK is poised for growth, with supportive government policies, technological advancements, and a clear commitment to expanding renewable energy capacity.
While the cost of solar panels remains a consideration for homeowners, the long-term benefits and potential savings make solar energy an increasingly attractive option. With the UK's ambitious targets and the global shift towards cleaner energy, solar panels are set to play a crucial role in the country's energy landscape.